Agami
Scalable Visual Analytics over Multidimensional Data Streams

Authors
Mingxin Lu, Edmund Wong, Daniel Barajas, Xiaochen Li, Mosopefoluwa Ogundipe, Nate Wilson, Pragya Garg, Alark Joshi, and Matthew Malensek
Overview
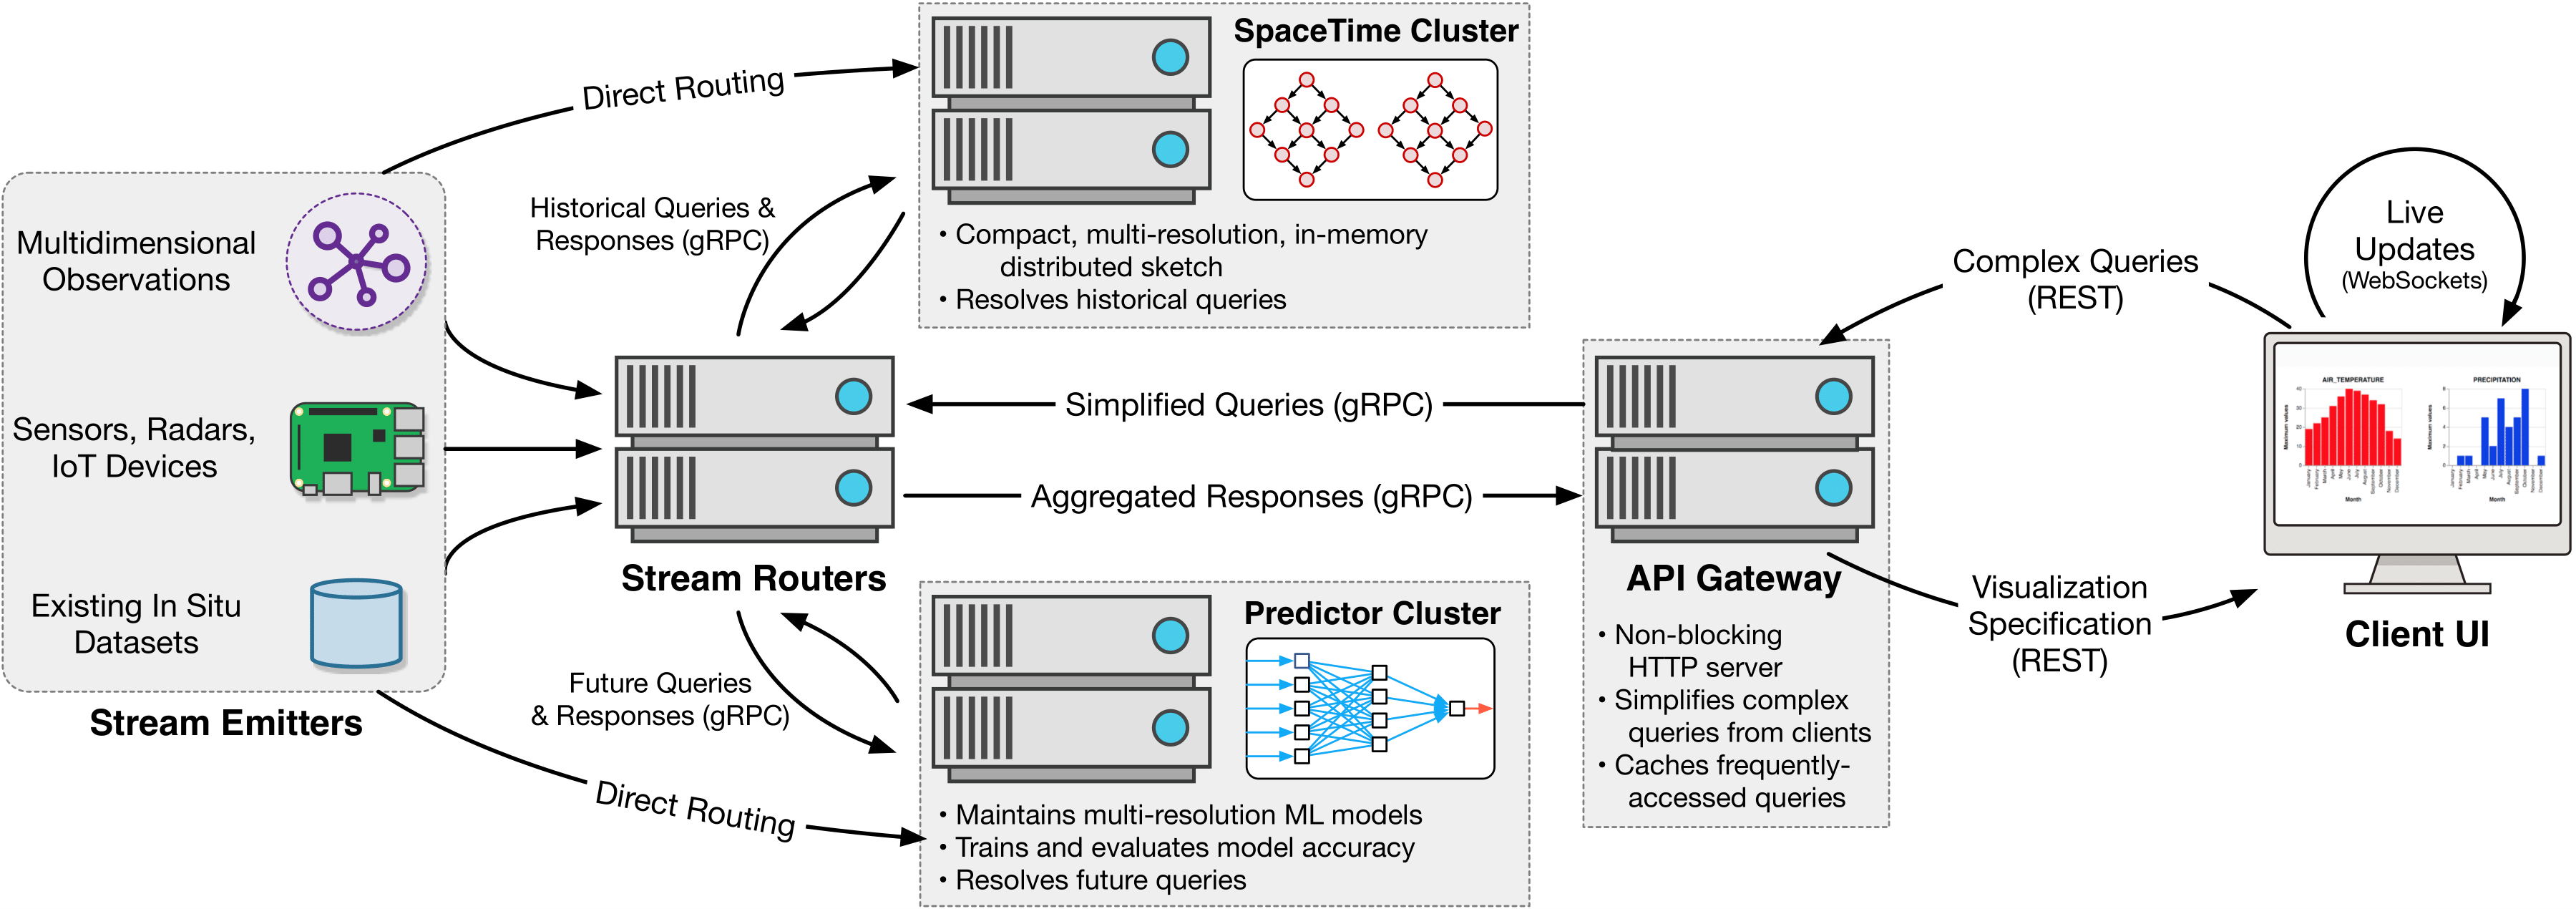
As worldwide capability to collect, store, and manage information continues to grow, the resulting datasets become increasingly difficult to understand and extract insights from. Interactive data visualizations offers a promising avenue to efficiently navigate and gain insights from highly complex datasets, but the velocity of modern data streams often means that precomputed representations or summarizations of the data will quickly become obsolete. Our system, Agami, provides live-updating, interactive visualizations over streaming data. We leverage in-memory data sketches to summarize and aggregate information to be visualized, and also allow users to query future feature values by leveraging online machine learning models. Our approach facilitates low-latency, iterative exploration of data streams and can scale out incrementally to handle increasing stream velocities and query loads. We provide a thorough evaluation of our data structures and system performance using a real-world meteorological dataset.
Build
- AggregatorServer
- AggregatorNode(s)
- DataEmitter(s)
- API_layer
First, we need to install the correct libraries. We can do this with:
pip install -r requirements.txt
This may be pip3 depending on your system.
It is highly encouraged to use a virtual environment since there are many libraries in the requirements file.
Then you can choose between manual build or automated local build for building.
Note this project is intended for Python 3.
Quickstart
For convenience, a quick start bash script has been added. This contains all the same manual commands for local deployment in a one command.
Just run bash run.sh to run all the components. Since all components run in a single command, all outputs cannot be displayed all at once. The AggregatorServer output is written to logs/server.log, the AggregatorNode output is written to logs/node{node_id}.log, the DataEmitter is written to logs/emitter.log, and the API_layer will be written out to logs/api.log
The AggregatorServer and API_layer are given 3 seconds to start up properly. Afterwards, AggregatorNodes are given 3 seconds to start up properly as well. This accounts for most of the delay when running this script.
It may be possible for outputs to be buffered. In this case, the output will not be written to the file immediately.
Manual Build
The manual build instructions includes general instructions on building each individual segment of the system.
To start the Aggregator Server, run:
python AggregatorServer.py
Usage: AggregatorServer.py [OPTIONS]

Options:
-h, --host TEXT: Set AggregatorServer host (default="")
-p, --port INTEGER: Set AggregatorServer port (default=55555)
--cli BOOLEAN: Enable or disable command line interface (default=True)
--worker INTEGER: Specify number of threads to dispatch records (default=2) --help: Show this message and exit.
Example: python AggregatorServer.py
Each AggregatorNode will be assigned to a feature. As such, it is typical for multiple AggregatorNodes to be running at a time. Note that the AggregatorServer must be running first. To start a Aggregator Node, run:
python AggregatorNode.py start <aggregatorserver_host> <aggregator_node_port>

aggregatorserver_host: the host of the AggregatorServer
aggregator_node_port: the port of the AggregatorNode
You can specify the host of aggregator node by
Example on localhost: python AggregatorNode.py start localhost 55556 --host localhost
Each node should have a different port number.
Now we can simulate live data with the DataEmitter. This will send data to the AggregatorServer.
python DataEmitter.py serial <data path> <aggregator server host>

data path: the path to the data file (sample is in data/2018/CRNS0101-05-2018-KS_Manhattan_6_SSW.txt)
aggregator server host: host to the AggregatorServer in host:port format
Example: python DataEmitter.py serial data/2018/CRNS0101-05-2018-KS_Manhattan_6_SSW.txt localhost:55555 -i 0
Finally, start the API_layer by:
python API_layer.py <aggregator server host> <port>

aggregator server host: the host of the AggregatorServer
port: the port to connect to the AggregatorServer
Example: python API_layer.py localhost 2222
Head to http://localhost:5000 to view the updating visualizations as data streams in.